The table and charts below give information on the police budget for 2017 and 2018 in one area of Britain. The table shows where the money came from and the charts show how it was distributed.
The table and charts below give information on the police budget for 2017 and 2018 in one area of Britain. The table shows where the money came from and the charts show how it was distributed.
Summarise the information by selecting and reporting the main features, and make comparisons where relevant.
- The table and charts below give information on the police budget for 2017 2018 in one area of Britain.
- The table shows where the money came from and the charts show how it was distributed.
- The police budget for 2017 2018 in one area of Britain
- The amount of budget which was planned for 2017 and 2018 year in Britain
- ---
- Money source
- Budget source
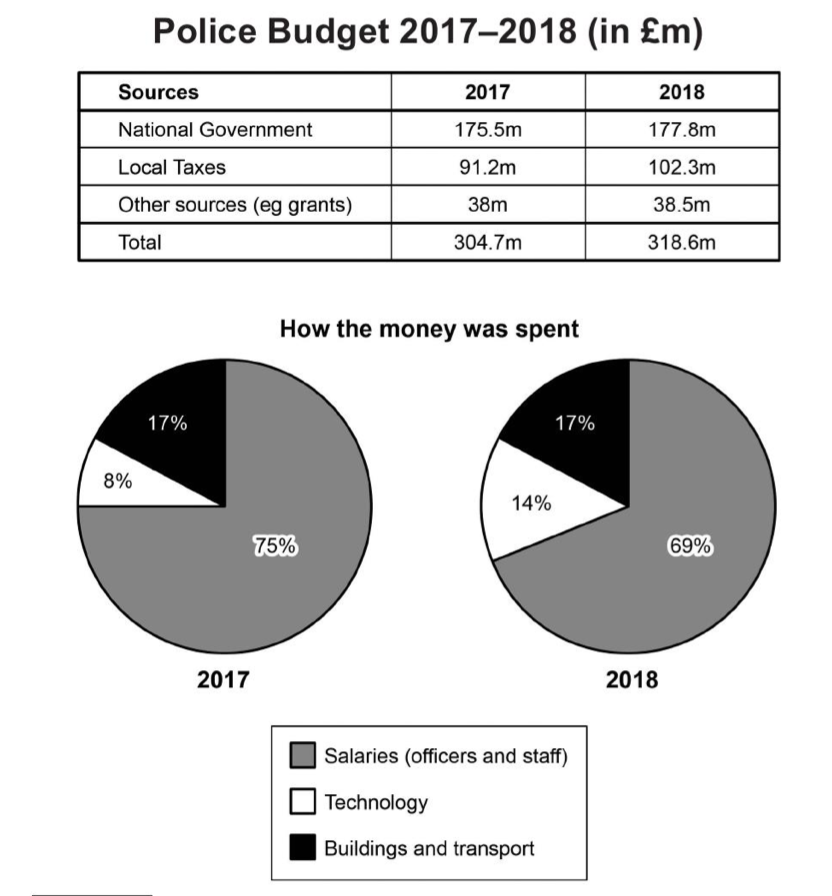
The pair of maps depict the Britain police department budget and expenditure plan for two different year, 2017 and 2018.
Overall, it can be seen that, Britain police department's main budget is funded by Government, whereas this budget's majority portion goes to police officers and stuffs salaries, 75% and 69% respectively in given years.
Looking at at first table dataset, it is evident that, National Government is the main source of Britain police budget, 175.5m in 2017, which increased to 177.8m in 2018. Local taxes is another big contributing budget source, it drawn 91.2m in 2017, by the year 2018 it raised to 102.3m. Other sources like grants contributed the lowest amount of the budget, in 2017 and 2018. Overall, total fund was 304.7m and 318.6m respectively in 2017 and 2018.
Looking at the pie chart, officers and stuffs salary is the highest portion of the expenditure in 2017 and 2017, which is stood at 75% but declined to 69% in 2018. Building and transport expenses accounted 17% for both year, where as technology usage stood at 8% in, by 2018 that spending raised to 14%.