The line graph below shows changes in the amount and type of fast food consumed by Australian teenagers from 1975 to 2000
Question
The line graph below shows changes in the amount and type of fast food consumed by Australian teenagers from 1975 to 2000
Noun phases
- The amount and type of fast food consumption
- The amount and type of fast food which was consumed
- Different types of fast food consumption
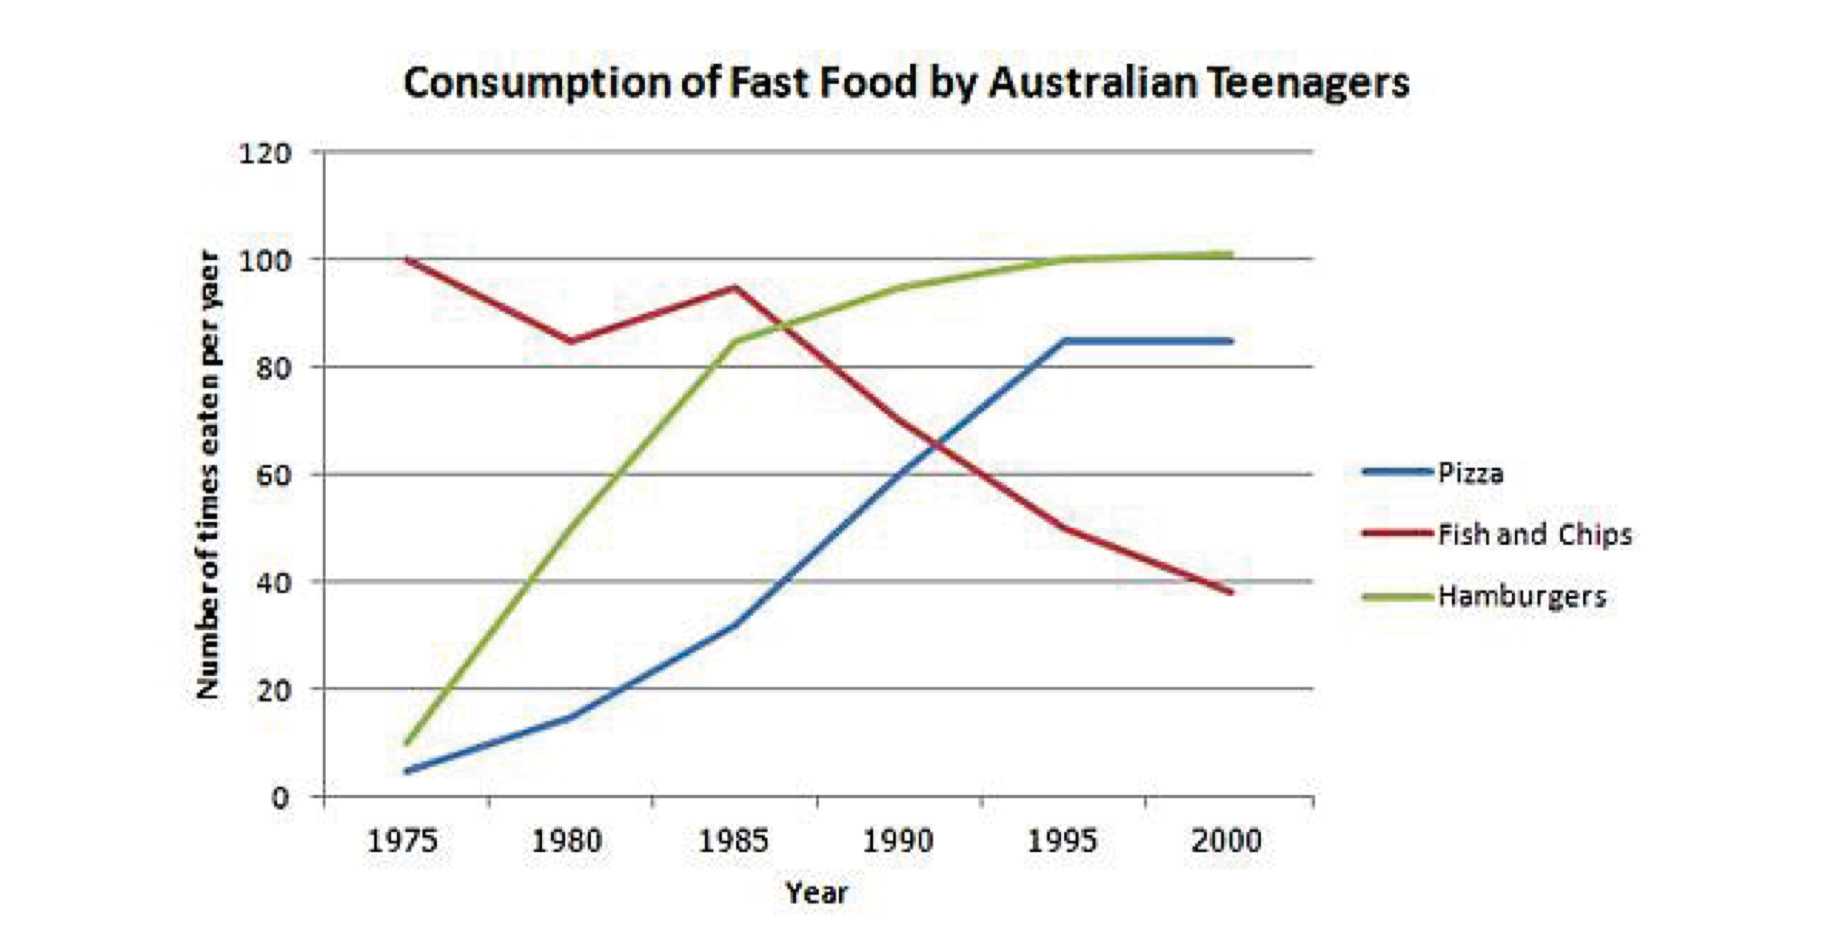
The line graph illustrates how the different types of fast food consumption changed among Australian teenagers over a 30-year period time, which is started in 1975.
Overall it can be seen that, the Pizza and hamburgers consumption showed a geometric demand uprising, though which was very low at initial stage, whereas, the amount of fish and chips consumption had started with a big number but it was lowering over the entire period of course.
Looking at the line chart carefully, it is evident that Pizza and Hamburgers demand was pretty low demanding item in 1975 Australian teenagers, those are at nearly 10 and 5 times respectively in a year. After the year 1980, this scenario was changing, by the year 2000 Pizza and Hamburgers consumption rate gone to the highest pick at over 80 and 100 times.
On totally opposite to this, the amount of fish and chips which was consumed by Australian teenagers was noticeably high amount, initially at 100 times per year. It faced a sudden fall to around 82 then raised to approximately 98 times per year in 1985. After 1985 the amount of fish and chips consumption started declining exponentially, eventually by 2000 it ended up bellow 40 times per year.