The graph below shows the average monthly change in the prices of three metals during 2014.
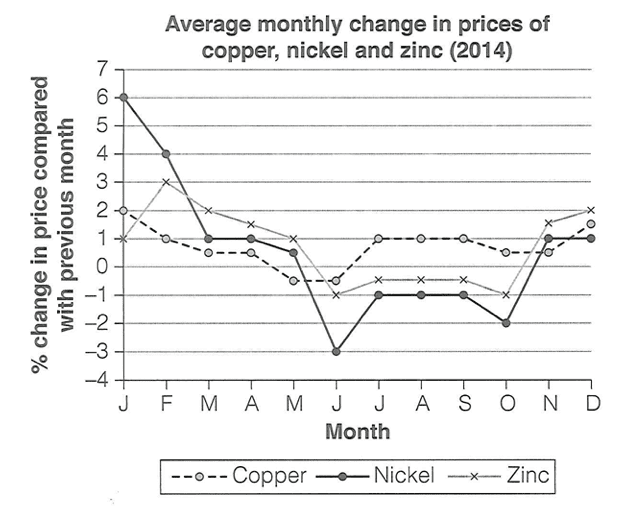
The line graph illustrates how the amount of average price fluctuated for three metals in a specific year 2014.
Overall, it can be seen that, among three metals Nickel spotted the highest price fluctuation, whereas Coper and Zinc faced slight price change but ended up to almost similar price fluctuation compared to initial figure.
Looking at the Nickel dataset from the provided line graph, percentage price change is at pick 6% in January, which is significantly dropped to 1% by the March month. From month May to June, Nickel price faced another percentage price drop noticeably to negative 3%, which is the lowest price change in the overall course of period. By the end of year 2014, in December it reached to the chart equilibrium position that is 1%.
Looking at the remaining dataset of Copper and Zinc, in the beginning of the year in January, Zinc percentage price change stood at 1%, which is the chart equilibrium position. Max price change is spotted in month February to 3%. Zinc faced percentage price decline to -1% twice in June and October. By the end of year 2014 percentage change reached slightly up from equilibrium to 2%. However, Copper percentage price change stood at 2% in the beginning of year 2014, which is fall to negative 0.5% in month May and June. After month July the percentage price change was almost constant and at the end of the year reached slightly up of 1%.