The charts show the distribution of money spent on music in three different years in Northern Ireland
The charts show the distribution of money spent on music in three different years in Northern Ireland
- Music spending
- The spending on music
- The amount of money that was spent on music
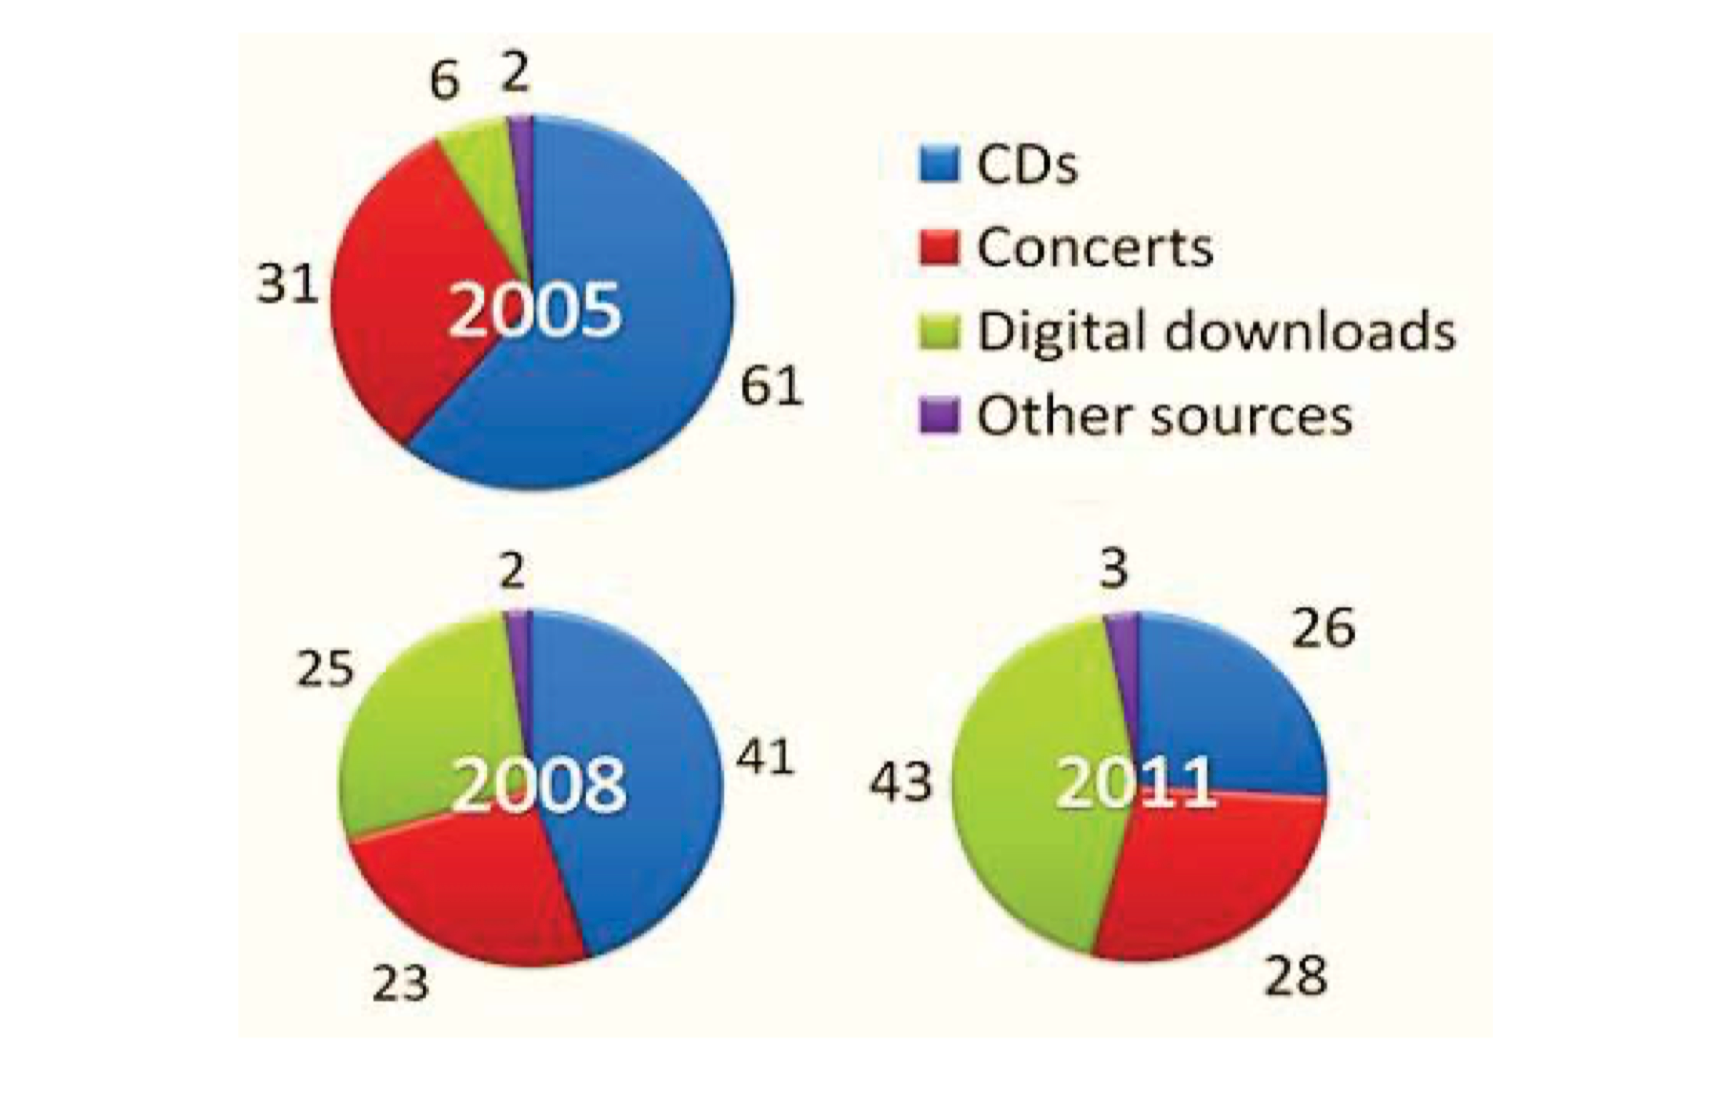
The pie charts show the amount of money that was spent on music over three years in Northern Ireland.
Overall, it can be seen that the spending on music using CDs was the highest for 2 years, while other categories remained low. Digital downloads comprised a very small portion, it increased noticeably
Looking at the pie charts in more details, Concerts were always popular in three all years of 2005, 2008 and 2011, and showed little fluctuation. Music spending in CDs was so high in 2005, started with 61% however, it gradually declined in the following years of 2008 and 2011, which ended up to 60%.
On the other hand, Digital downloads was not popular much, started with 6% in 2005, however it drastically increased to the most popular music spending means, reached 43% by 2011. Spending on other categories remained low, rising slightly to 3% in 2011.