Mixed chart writing sample
Dynamic chart
- (NP 1/2/3) increased from x in 2000 to y in 2005
- (NP 1/2/3) showed a similar trend, rising from x in 2000 to y in 2010
- (NP 1/2/3) Increased by highest margin/greatest amount, at x
- the percentage of NP jumped/declined to 41% in 2008 and then to 73% in 2010
- There was also a significant rise/decline/fall in NP, with figures reaching 41% and 35% respectively in 2010
Future
- (NP 1/2/3) is anticipated to ...
- (NP 1/2/3) is expected to ...
- (NP 1/2/3) is predicted to ...
Static Charts
- (NP 1/2/3) stood at x for men, compared to y for women.
- (NP 1/2/3) stood at x for men, as opposed to t for women.
- (NP 1/2/3) stood at x for men, and y for women.
- (NP 1/2/3) stood at x and y for men and women respectively.
- (NP 1/2/3) was higher for men than for women, at x and y respectively.
- (category name; the highest/the lowest; this)
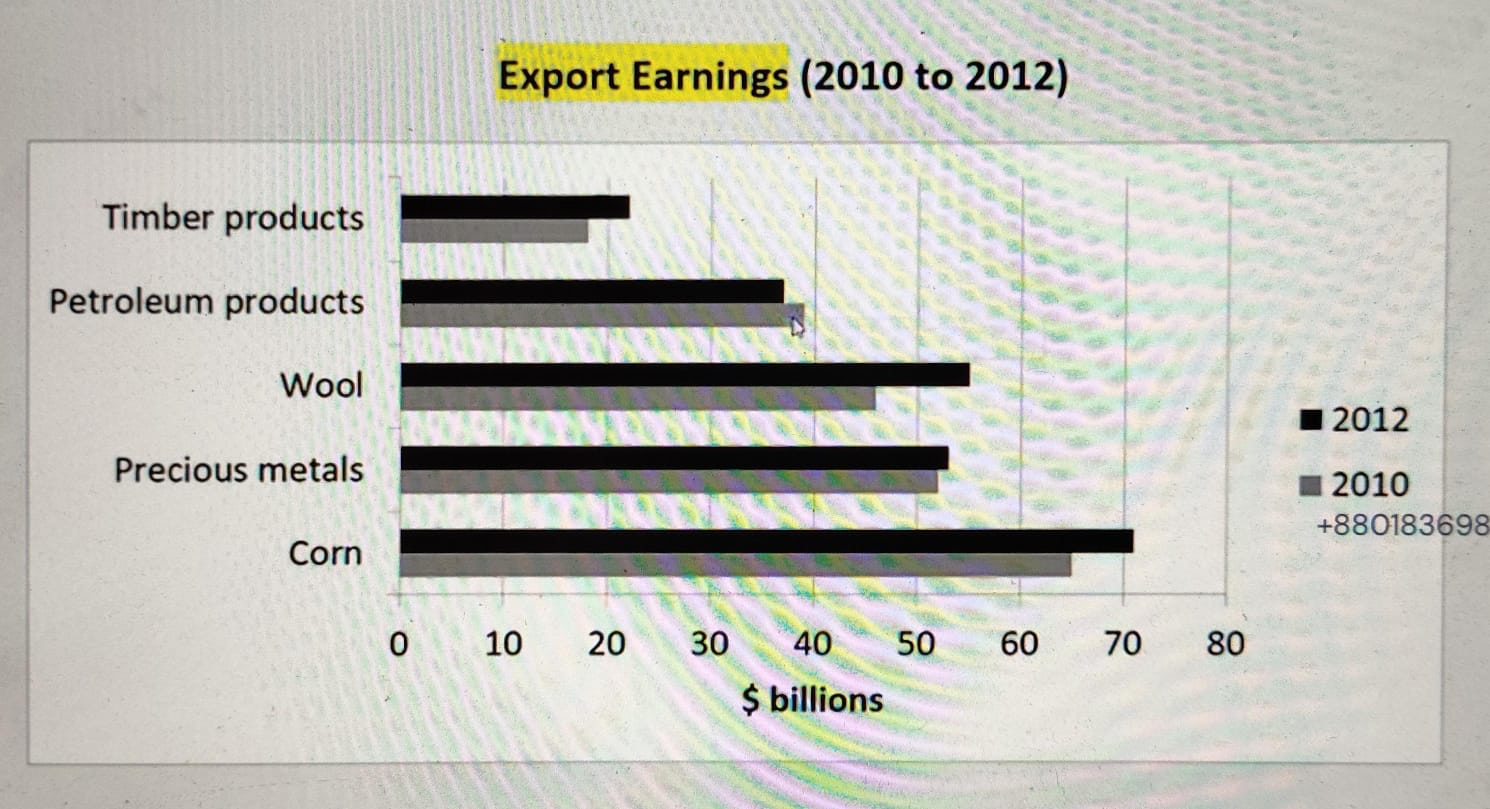
Overall, it can be seen that the amount of money which was earned from exports increased for all categories except for petroleum products, which declined. This observation is supported by the data in the table.
Looking at the 2010 data set in more detail, it can be seen that the amount of money which was earned from exports of corn was the highest, at about $65 billion. Export earnings from precious metals and wool stood at approximately $52 billion and $46 billion, respectively. Petroleum products earned approximately $38 billon, and earning from exports of timber products was the lowest of five categories at about $17 billion.
Turning to the year 2012 data set, it is evident that export earnings from corn, precious metals, wool and timber products all grew, to approximately $71 billion, $54 billion, $56 billion, and $23 billion, respectively. Petroleum products was the only category to show a decrease in export earnings. This number fell slightly to about $36 billion.
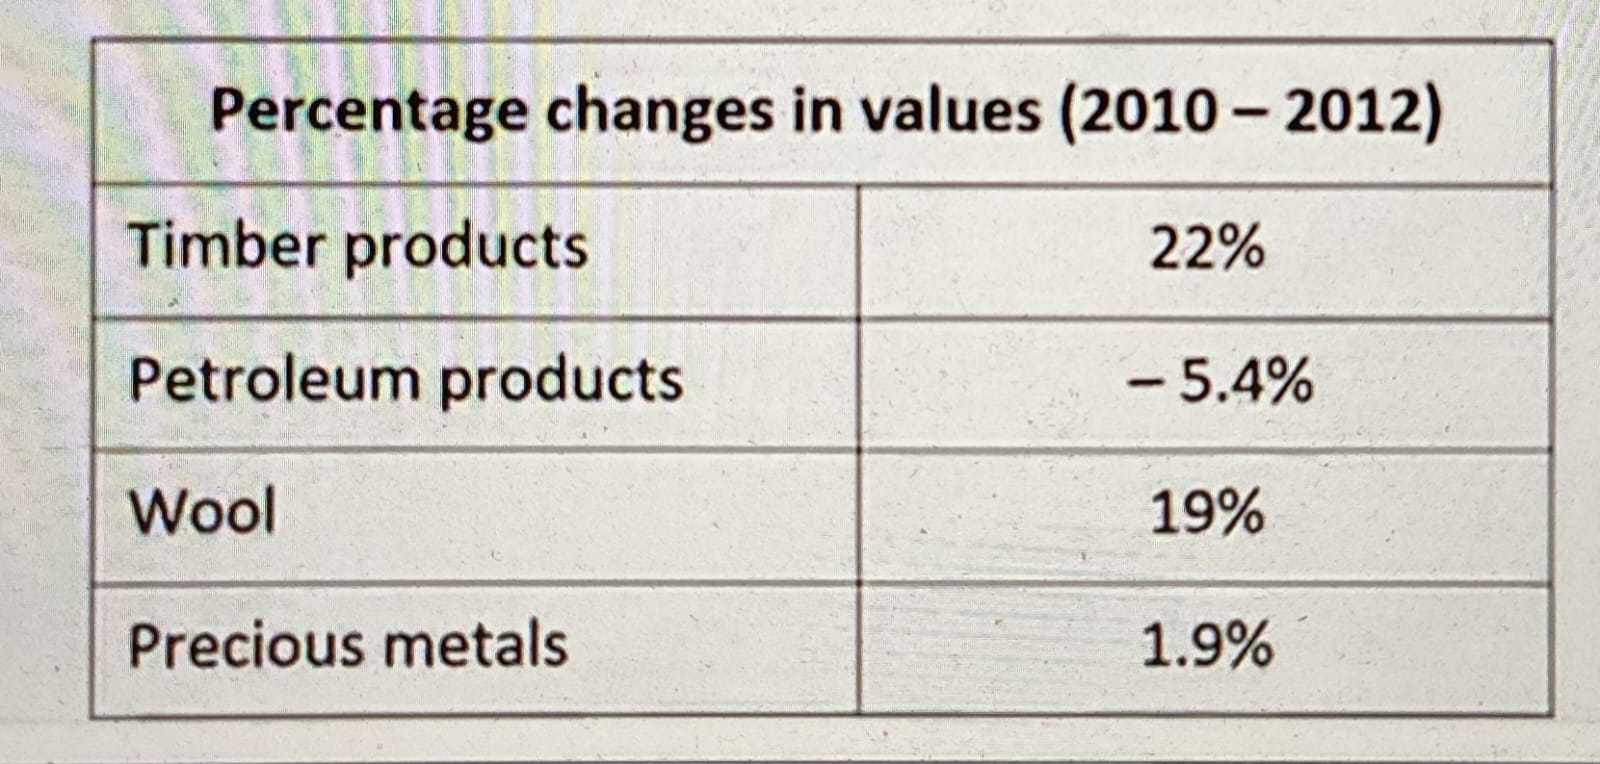
The table shows that export earnings from timer products increased by the highest margin, at 22%. This was followed by wool at 19%, corn at 9.2%, and precious metals at 1.9%. Earnings from petroleum products decreased by 5.4% from 2010 to 2012.